


Investment zones
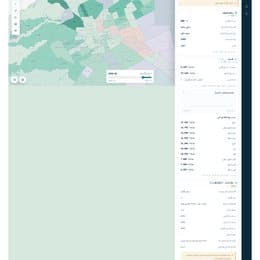
Visual highlighting of the areas with the strongest investment appeal by demand and prices.

Takamol Advanced built one integrated digital ecosystem: the Real Forsa platform for discovering real estate opportunities and analysing the market, and the Real Invest engine inside it for in-depth feasibility studies, giving investors, landowners and developers a complete picture from the first look to the final decision.
Live data, interactive maps, precise indicators and shareable studies: everything you need to make a confident real estate decision, in one place.
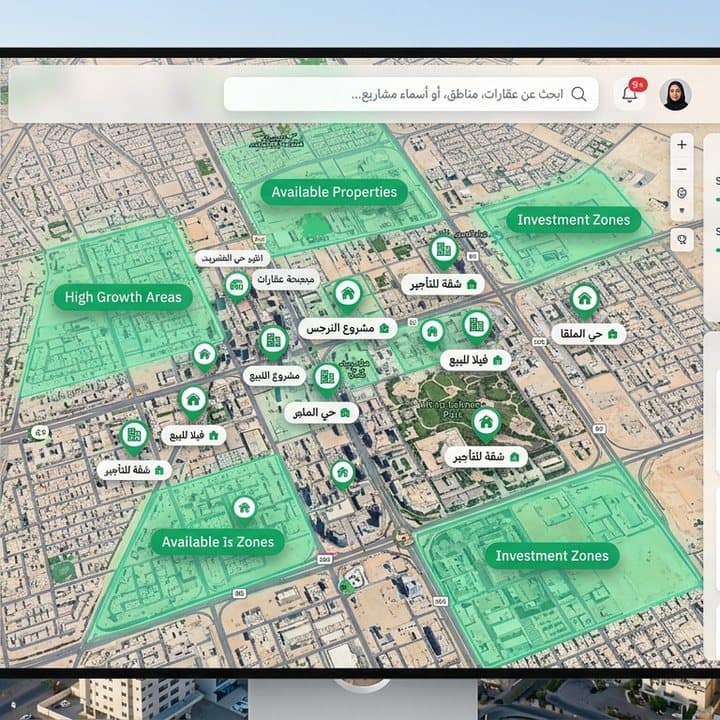
Real Forsa is an integrated platform providing advanced real estate solutions, helping you explore opportunities and analyze the market professionally.
A smart tool for analyzing plots and layouts, providing feasibility studies, and assessing risks to ensure the best return on investment.
From spotting the opportunity to the investment decision
Real Forsa is a smart real estate platform that connects investors and property seekers with the best opportunities available in the Saudi market. It brings together interactive maps, up-to-date market data, and advanced assessment and analysis tools, condensing the journey of searching, comparing and studying into one easy, safe and reliable experience.
An interactive map showing investment zones, high-growth areas and available properties, with smart filters for price, area and property type, so you reach the right opportunity in minutes instead of weeks of searching.
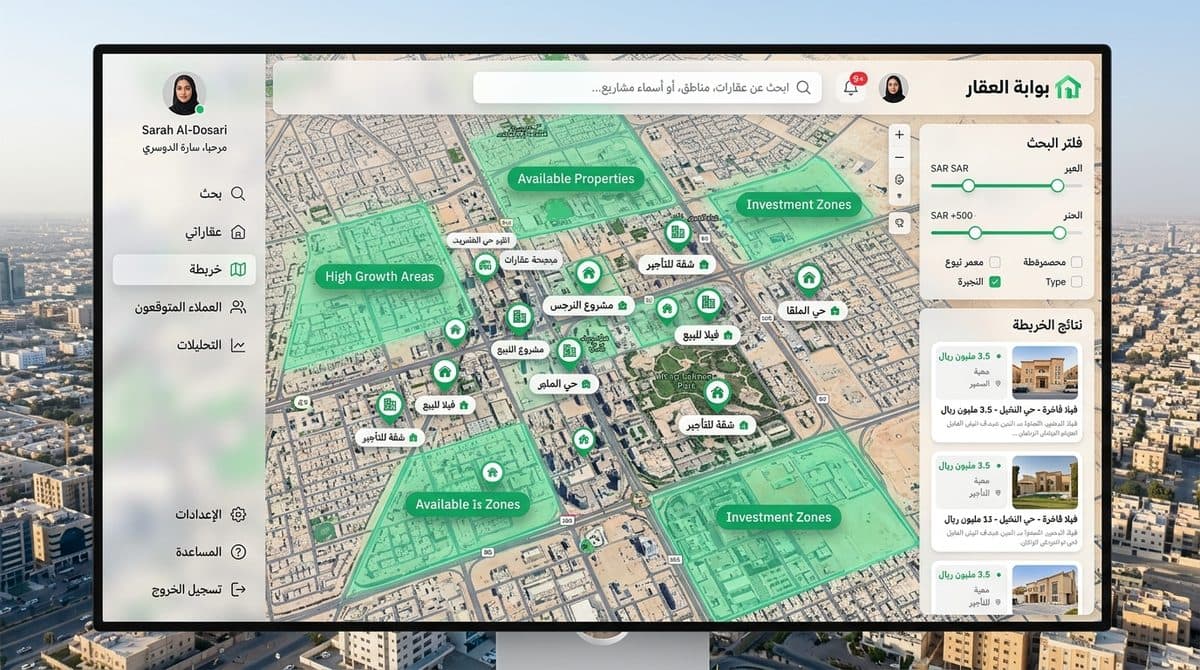
Visual highlighting of the areas with the strongest investment appeal by demand and prices.
Spot neighbourhoods where demand and prices are rising before it becomes obvious to everyone.
A live view of listed opportunities with their key data and exact location.
Filter by price, area, type and location to find what fits your goal.
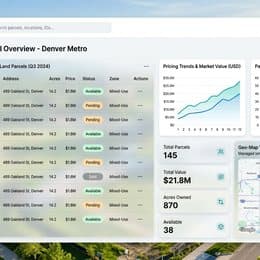
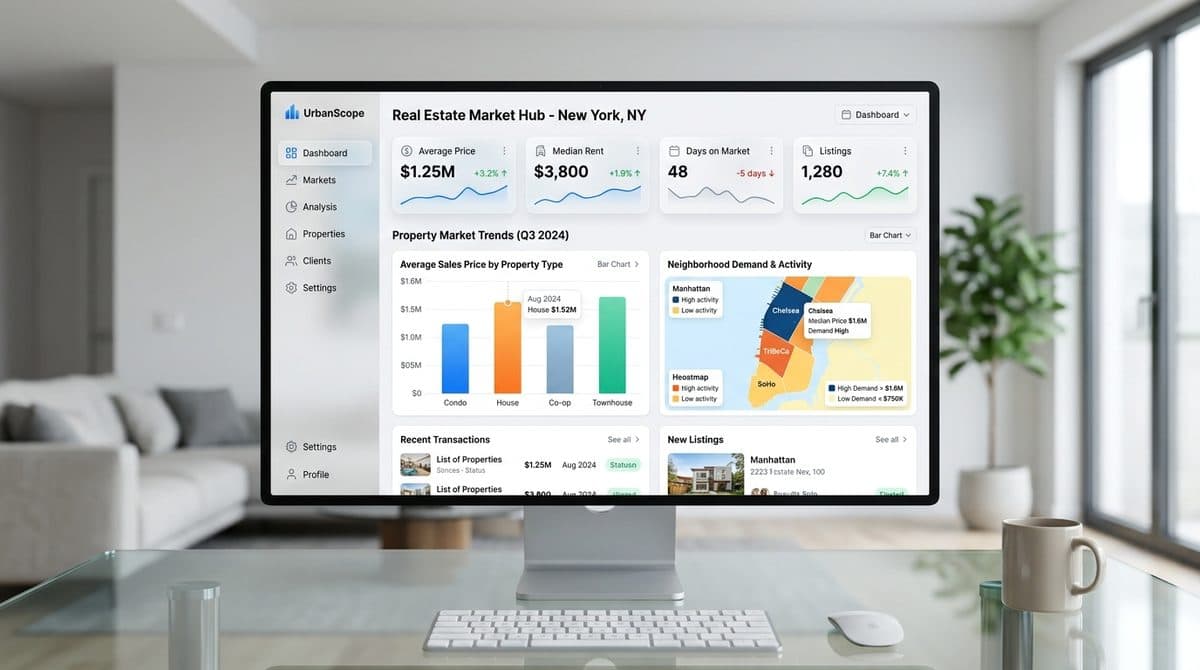
Analytical dashboards showing price trends, transaction volume and neighbourhood performance, plus a summary for every plot or property: area, expected price and growth rates, so you compare with confidence before you decide.
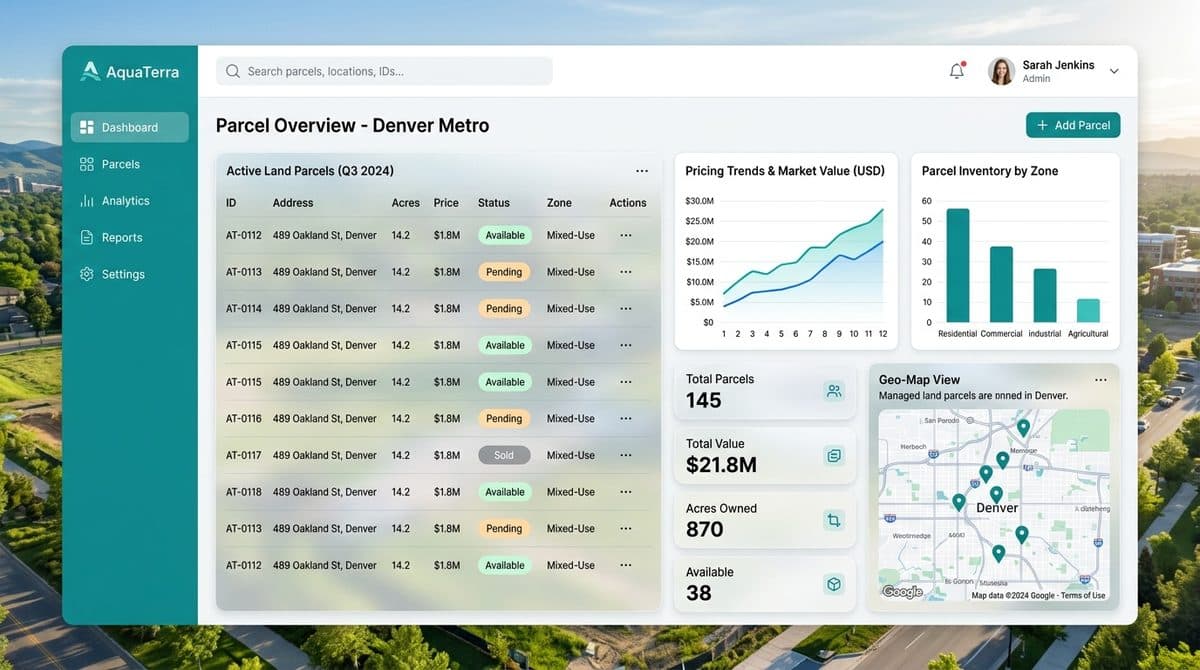
Historical and current price curves by area and property type.
A card for each plot combining area, expected price and the key indicators.
Neighbourhood performance side by side to pick the best location for your goal.
Data refreshed continuously so your decisions reflect today's reality.
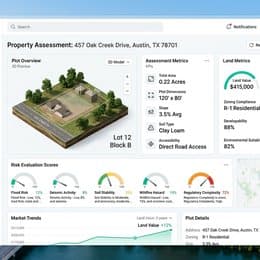
An instant assessment of any property or plot: the key criteria, the investment suitability score, the potential risks and the most suitable use, all on one clear card.
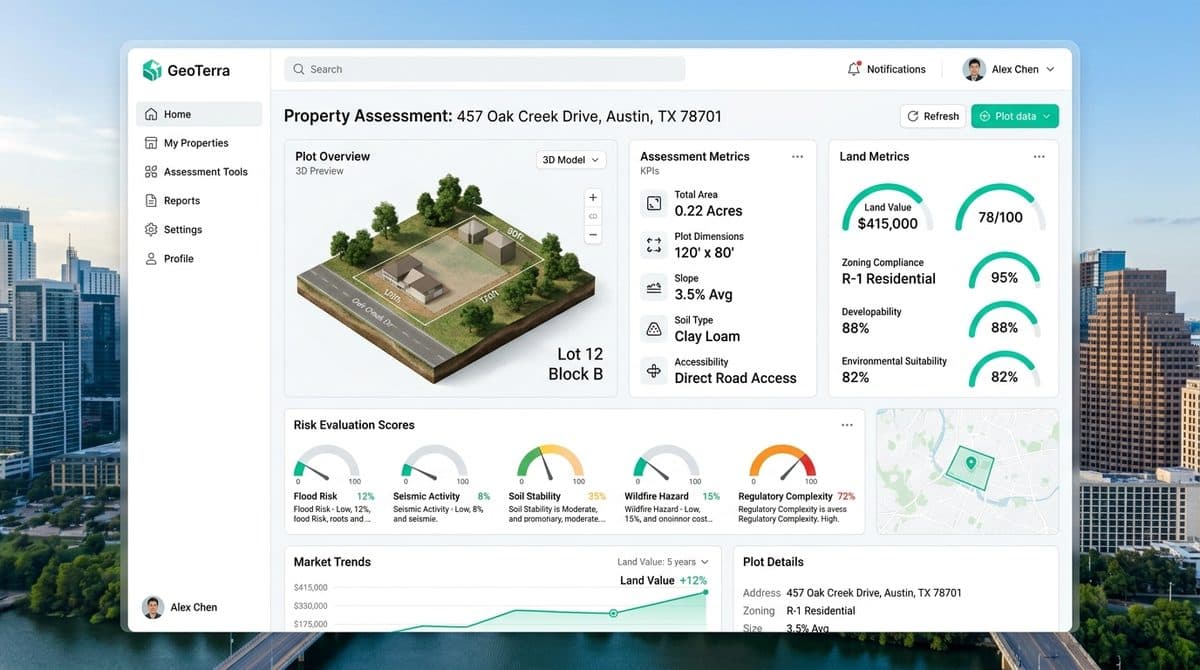
An indicator summarising how well the property fits your investment goal.
Early detection of warning factors: location, price, regulation and liquidity.
The highest-yielding use suggested from regulatory and market inputs.
A practical conclusion that helps you proceed, negotiate or look for an alternative.
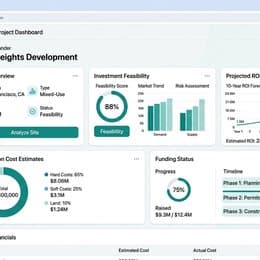
Every project gets a dashboard that brings together investment feasibility, projected return, cost estimates, the funding plan and the timeline, so you manage your project and follow its indicators from one place.
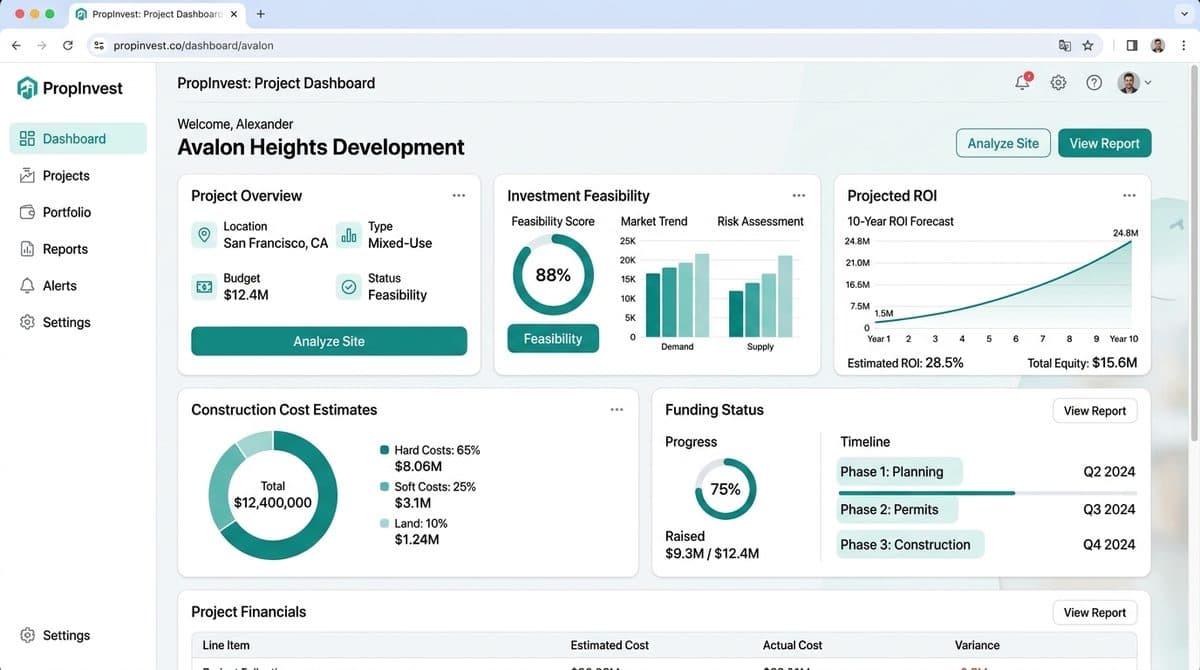
Projected return and feasibility indicators updated with every change in the inputs.
A breakdown of construction, development and operating costs across project phases.
The funding structure, its sources and coverage ratios in one view.
Project phases and key milestones with progress tracking.
Share-ready executive reports summarising your real estate portfolio's performance: total value, occupancy rates, returns and the best-performing assets, on a map and in clear indicators everyone understands.
Total value, returns and occupancy rates at a glance.
The geographic spread of your assets with each location's performance.
Assets ranked by value and income so you know what drives your portfolio.
Export and share the report with partners and financiers in one click.
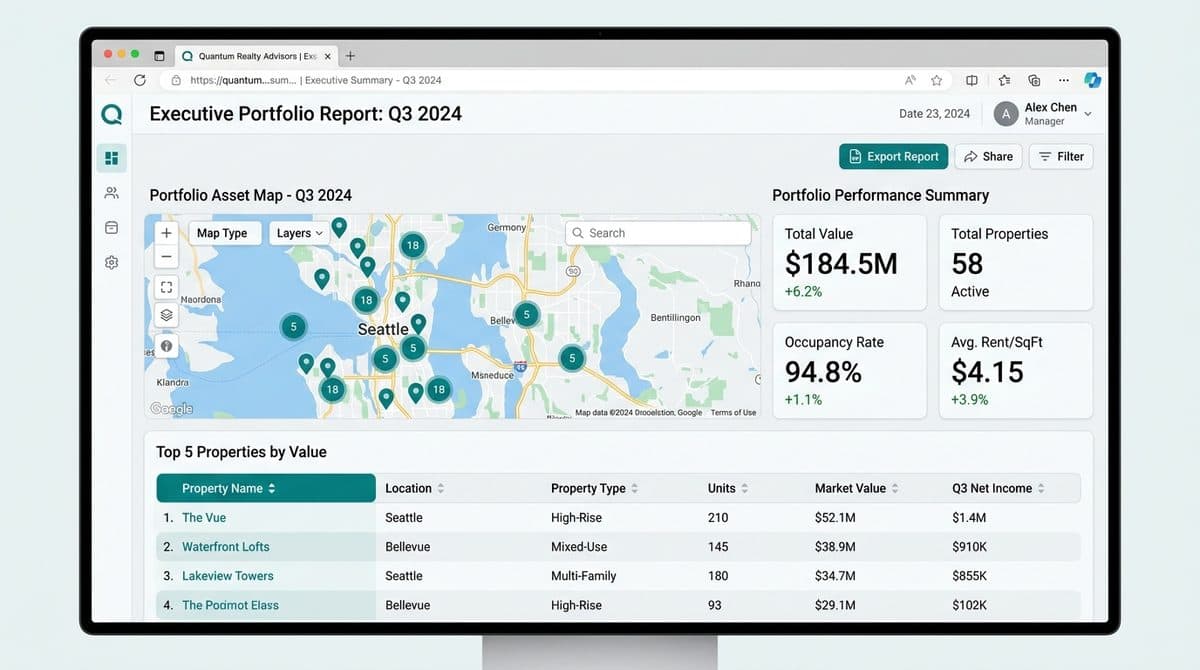
One report gives you and your partners the full picture without drowning in detail.
Trusted sources and continuous updates of prices and indicators.
A clear interface and simple steps from search to decision.
Discover the opportunity, then study it in depth in the same place with no re-entry.
An advisory team that helps you read the results and turn them into a plan.
Contact our team for a platform demo or to join the early-access list.